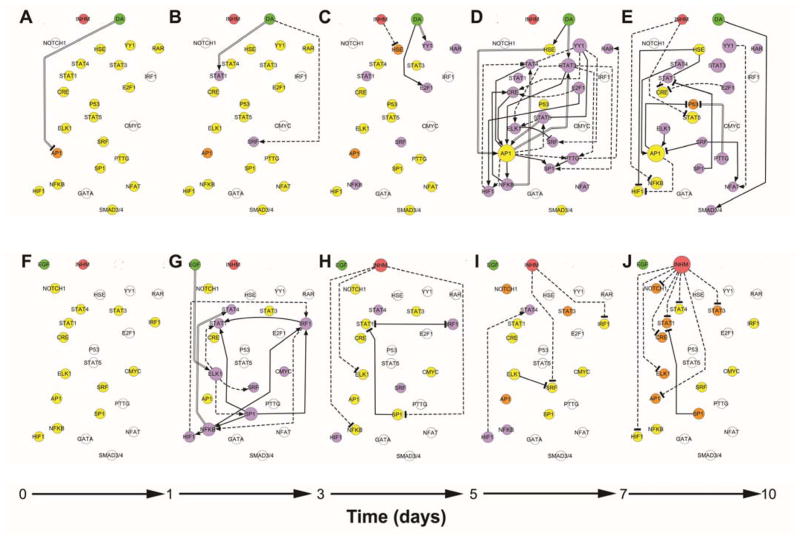
Figure 2. Dynamic transcription factor activity networks upon DA or EGF treatment of 10A.ErbB2 cells.
Dynamic transcriptional consensus networks upon DA activation between 0 to day 1 in culture (A), day 1 to day 3 (B), day 3 to day 5 (C), day 5 to day 7(D) and day 7 to day 10 (E). Panels F to J represent the corresponding dynamic transcriptional networks upon EGF activation. Treatments, TFrs and inhibitory mechanism are represented as nodes, while the connections between them are represented by directed edges. Active treatments are symbolized by green circles; inhibitory mechanism, by a red circle. TFrs that are activated with respect to the beginning of the culture based on their median experimental discretize value are purple; deactivated TFrs are orange and no change in activity is denoted by yellow. TFrs that are not modulated by the treatment at any of the explored experimental time points are represented in white. Active or present edges at a given culture time interval are colored in black. Activating edges end in an arrow, deactivating edges end in a T. Edges obtained from prior knowledge are indicated by continuous lines; identified by inferences methods are denoted by discontinuous lines. Those identified by both methods are marked by two parallel lines.

