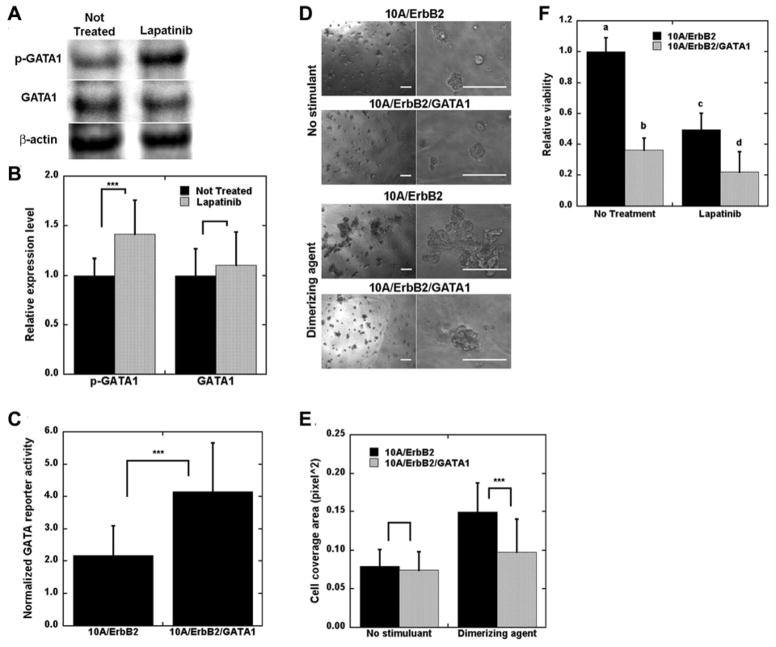
Figure 5. Overexpression of GATA1 decreased structure disorganization and cell viability.
10A/ErbB2 cells were stimulated with DA and treated with lapatinib for 1 d and lysates were probed on Western blots. A) Sample bands detected for phosphorylated GATA1 (p-GATA1), total GATA1 (GATA1), and β-actin. B) Quantification of relative p-GATA1 and GATA1 expression normalized to β-actin, represented by mean ± s.d. from five distinct samples (*** p<0.001). C) 10A/ErbB2 and 10A/ErbB2/GATA1 cells were transduced with GATA reporter gene and imaged with bioluminescence imaging to confirm increased activity. D) Sample images of 10A/ErbB2 and 10A/ErbB2/GATA1 cells growing in BME without and with DA stimulation for 10 d (scale bars represent 200 μm), with a quantification of cell coverage area (E) (solid bars – 10A/ErbB2; spotted bars – 10A/ErbB2/GATA1). F) Relative viability of cells stimulated with DA and subsequently treated with lapatinib for 3 d, with significant differences indicated by letters (a, b, c, d; α=0.05). For C, E, and F, bars represent mean ±s.d. from at least three replicates and three distinct experiments (***p<0.001).

