
Figure 7.
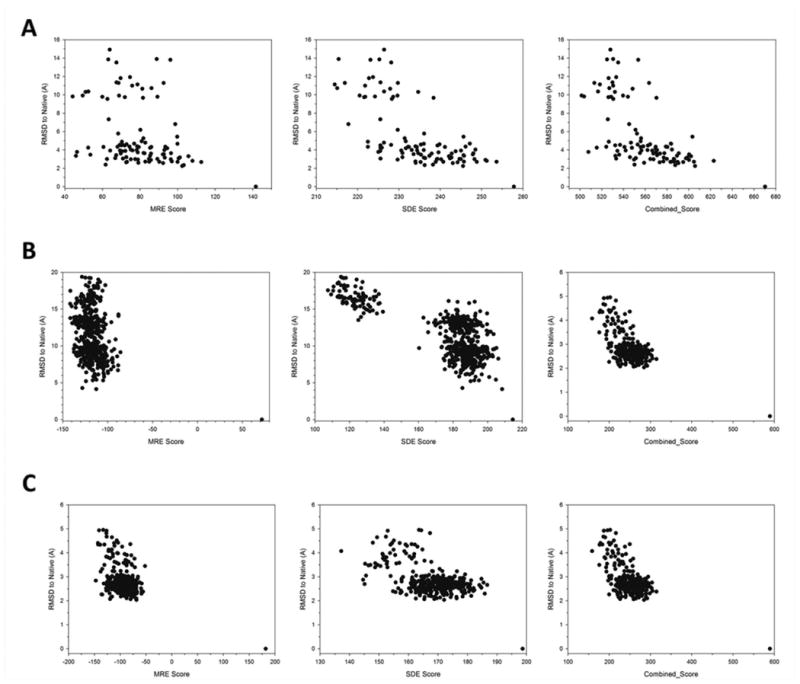
Examples of correlation between the environment scores and RMSD. RMSD of decoys are plotted relative to the residue environment scores for decoy sets of three proteins. Left, MRE (CC80 with γ=1.5); middle, SDE (QU_C2 with γ=2.0); Combined Score with MRE (CC80 with γ=1.5) and SDE (QU_C2 with γ=2.0) with a weight value of 2.05 were used. (A) 2chf from the Rosetta decoy set; Correlation coefficients (CC) are -0.31, -0.67, and -0.62, respectively from left to right. (B) 1gnuA from the I-TASSER decoy set. CC are -0.31, -0.74, and -0.77, respectively. (C) 1csp from the I-TASSER decoy set. CC are -0.50, -0.55, and -0.63, respectively.