
FIGURE 1.
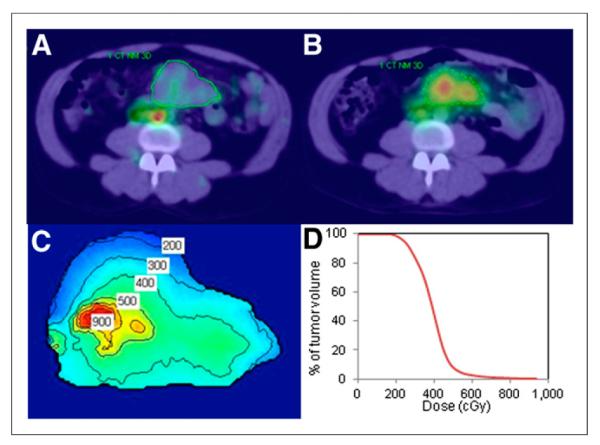
Imaging and dosimetry. Day 0 posttracer (A) and day 2 posttherapy (B) SPECT/CT images of patient with CT-defined tumor outlines. Tumor-absorbed dose distribution with isodose contours in cGy (C) and tumor dose-volume histogram (D).
Official websites use .gov
A
.gov website belongs to an official
government organization in the United States.
Secure .gov websites use HTTPS
A lock (
) or https:// means you've safely
connected to the .gov website. Share sensitive
information only on official, secure websites.
Imaging and dosimetry. Day 0 posttracer (A) and day 2 posttherapy (B) SPECT/CT images of patient with CT-defined tumor outlines. Tumor-absorbed dose distribution with isodose contours in cGy (C) and tumor dose-volume histogram (D).