
FIGURE 4.
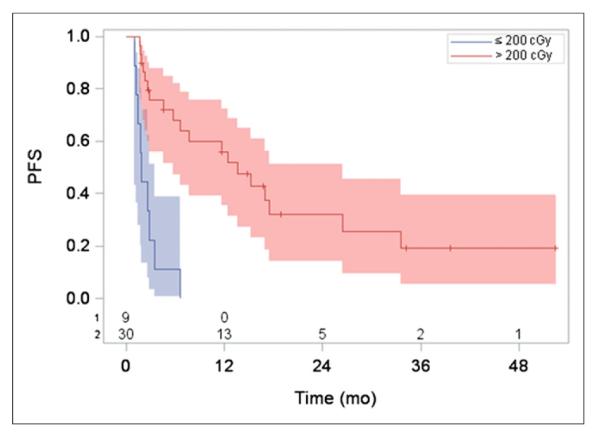
PFS (with number of subjects at risk and 95% confidence limits indicated) stratified by mean tumor-absorbed dose > 200 cGy and ≤ 200 cGy. Median PFS was 13.6 vs. 1.9 mo for the 2 dose groups (log-rank P < 0.0001).
Official websites use .gov
A
.gov website belongs to an official
government organization in the United States.
Secure .gov websites use HTTPS
A lock (
) or https:// means you've safely
connected to the .gov website. Share sensitive
information only on official, secure websites.
PFS (with number of subjects at risk and 95% confidence limits indicated) stratified by mean tumor-absorbed dose > 200 cGy and ≤ 200 cGy. Median PFS was 13.6 vs. 1.9 mo for the 2 dose groups (log-rank P < 0.0001).