
Fig. 3.
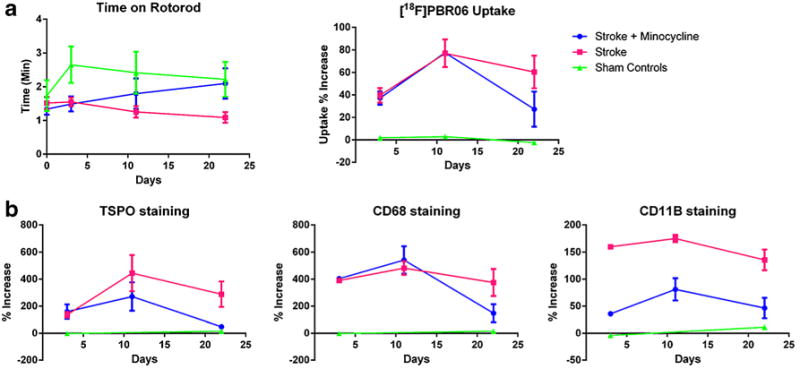
The time on rotarod and [18F]PBR06 accumulation (a) and microglial protein expression profiles for the three groups (b). Error bars represent SEM.
Official websites use .gov
A
.gov website belongs to an official
government organization in the United States.
Secure .gov websites use HTTPS
A lock (
) or https:// means you've safely
connected to the .gov website. Share sensitive
information only on official, secure websites.
The time on rotarod and [18F]PBR06 accumulation (a) and microglial protein expression profiles for the three groups (b). Error bars represent SEM.