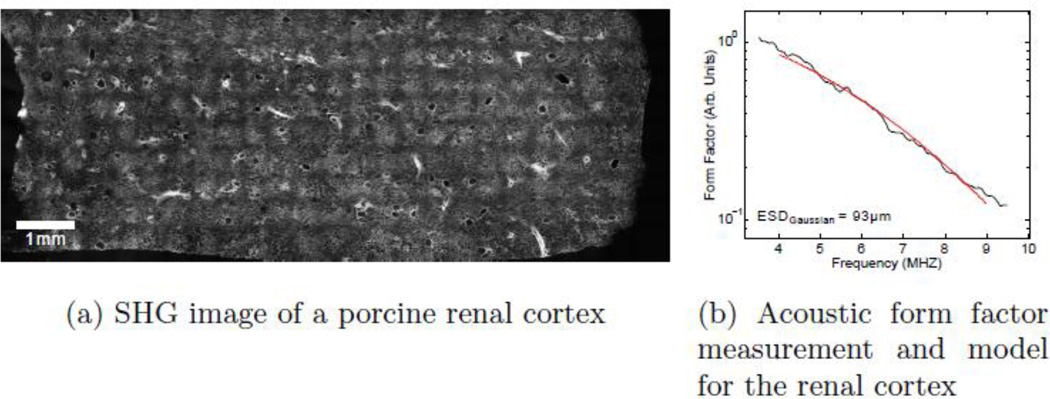
Figure 1.
(a) An SHG image of a fixed 200 µm thick slice of porcine kidney cortex tissue. Many of the larger, sparse 200 µm features seen throughout the sample are glomeruli, one of the dominant acoustical scatterers within this tissue. The cross-hatch pattern seen is an artifact due to both the relatively large fields of view imaged and stitching process. (b) The acoustic form factor data are shown to fit very well to the Gaussian model, as had been found in early ESD studies.

