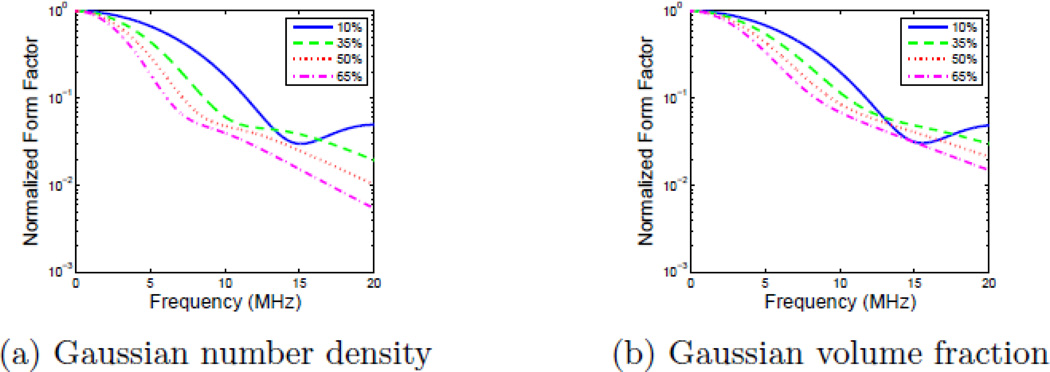
Figure 5.
Example theoretical compound frequency dependent form factors calculated using Faran scattering functions with a) Gaussian number density scaling, and b) Gaussian volume fraction scaling. Each plot shows four different size distributions with standard deviations of 10%, 35%, 50%, and 65% of the centroid value.

