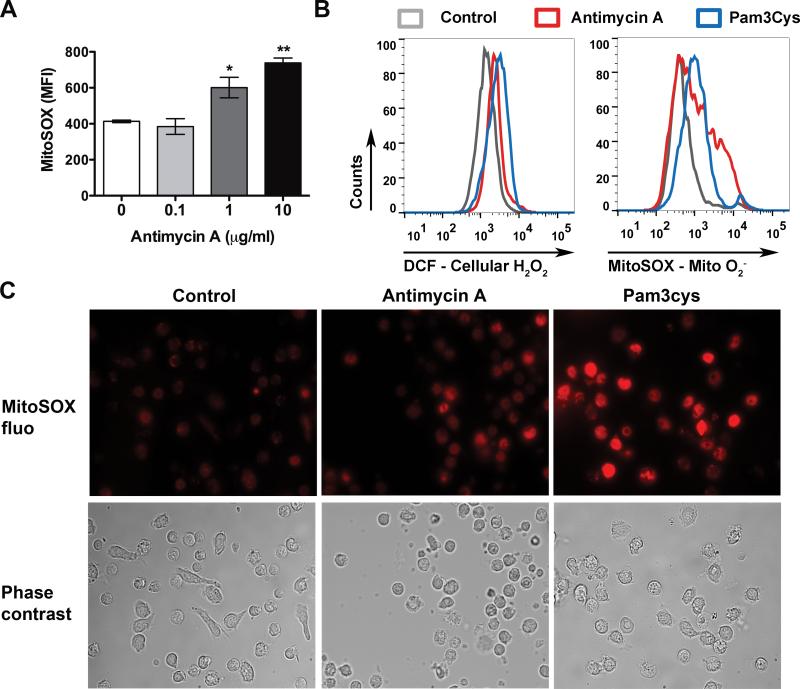
Figure 1. Antimycin A and Pam3Cys induce intracellular H2O2 and mitochondrial O2− production in peritoneal leukocytes.
A, Antimycin A leads to a dose-dependent mitochondrial O2− production. Thioglycollate-elicited peritoneal leukocytes were treated with antimycin A for 1 h and analyzed for mitochondrial O2− production with flow cytometry. n=3 in each group. * P < 0.05, ** P < 0.01 versus the untreated controls. Each error bar represents mean ± SEM. MFI, mean fluorescence intensity. The experiments were performed twice with similar results. B-C, Antimycin A- or Pam3Cys-induced intracellular or mitochondrial ROS production. Representative histograms of flow cytometry (B) and fluorescent images (C) are presented. Peritoneal leukocytes were treated with antimycin A (10 μg/ml) or Pam3Cys (20 μg/ml) for 1 h, incubated with 10 μM DCF or 2.5μM MitoSOX, and then analyzed for cellular H2O2 or mitochondrial O2− production, respectively, with flow cytometry (B) or fluorescent microscope (C). DCF = dichlorodihydrofluorescein diacetate; MitoSOX fluo = MitoSOX fluorescence; Mito O2− = mitochondrial superoxide; H2O2 = hydrogen peroxide.

