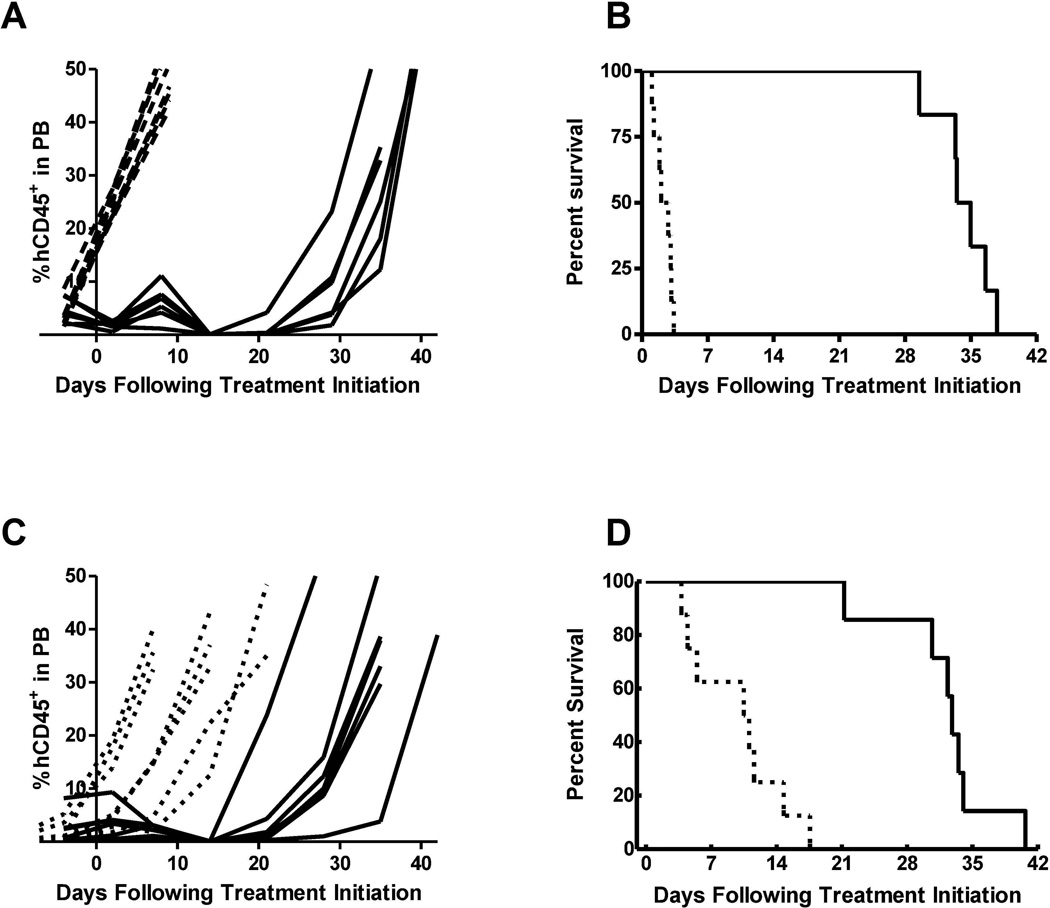
Fig. 2.
(A) Leukemia progression plots showing %huCD45+ cells in PB of individual mice engrafted with ALL-7 over time. (B) Kaplan-Meier plot of EFS over time for ALL-7-engrafted mice. (C) Leukemia progression plots showing %hCD45+ cells in PB of individual mice engrafted with T-lineage subtype ALL-8 over time. (D) Kaplan-Meier plot of EFS over time for T-lineage subtype ALL-8-engrafted mice. Dotted lines indicate vehicle-treated control animals while solid lines indicate CPX-351-treated mice.

