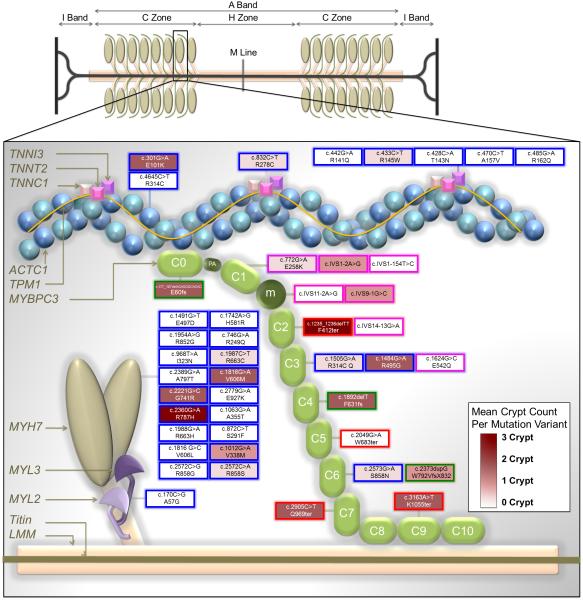
Figure 4.
Simplified diagram depicting the major proteins of the thick and thin filaments and the distribution of sarcomere gene mutations expressed in our study population and reported here by DNA change and amino acid change nomenclature. For MYBPC3 only, mutation variants are mapped to individual domains that are displayed in a hypothetical arrangement extending from the thick to the thin filament. This figure is an adaptation of the illustration by Harris et al.13 with the permission of Wolters Kluwer Health).
Key to transcript change per mutation variant: Blue border = missense mutations that cause single amino acid substitutions; Green border = insertions or deletions predicted to cause reading frame shifts (fs); Red border = nonsense mutations predicted to result in premature termination codons (ter); Pink borders = splice site donor/acceptor mutations.
Key to mean crypt prevalence per mutation variant: Mutation fill colors are weighted across a spectrum from white (0 crypts) to deep burgundy (3 crypts).
ACTC1 = actin, alpha cardiac muscle 1; MYH7 = myosin heavy chain, cardiac muscle beta isoform; MYL2 = myosin regulatory light chain 2, ventricular/cardiac muscle isoform; MYL3 = myosin light polypeptide 3; m = position of the MYBPC3 regulatory motif between domains C1 and C2; PA = proline/alanine-rich linker sequence between C0 and C1; TNNT2 = troponin T, cardiac muscle;TNNI3 = troponin I, cardiac muscle. Other abbreviations as in Figure 2.

