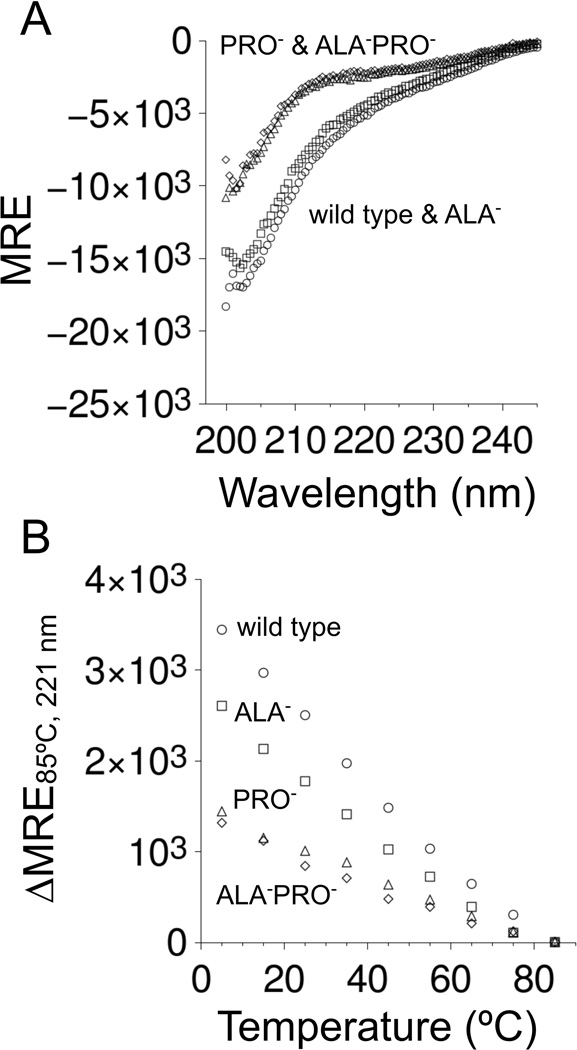
Figure 3. Effects of PRO-to-GLY and ALA-to-GLY substitutions on the CD spectrum of p53(1–93).
In both panels, wild type measurements were given with circles, ALA− with squares, PRO− with triangles, and ALA−PRO− with diamonds. Panel A shows the spectrum of each variant at 85°C. Panel B shows the temperature-dependence in the height of the local CD maximum that was observed at 221 nm (from insets of Figure 2).

