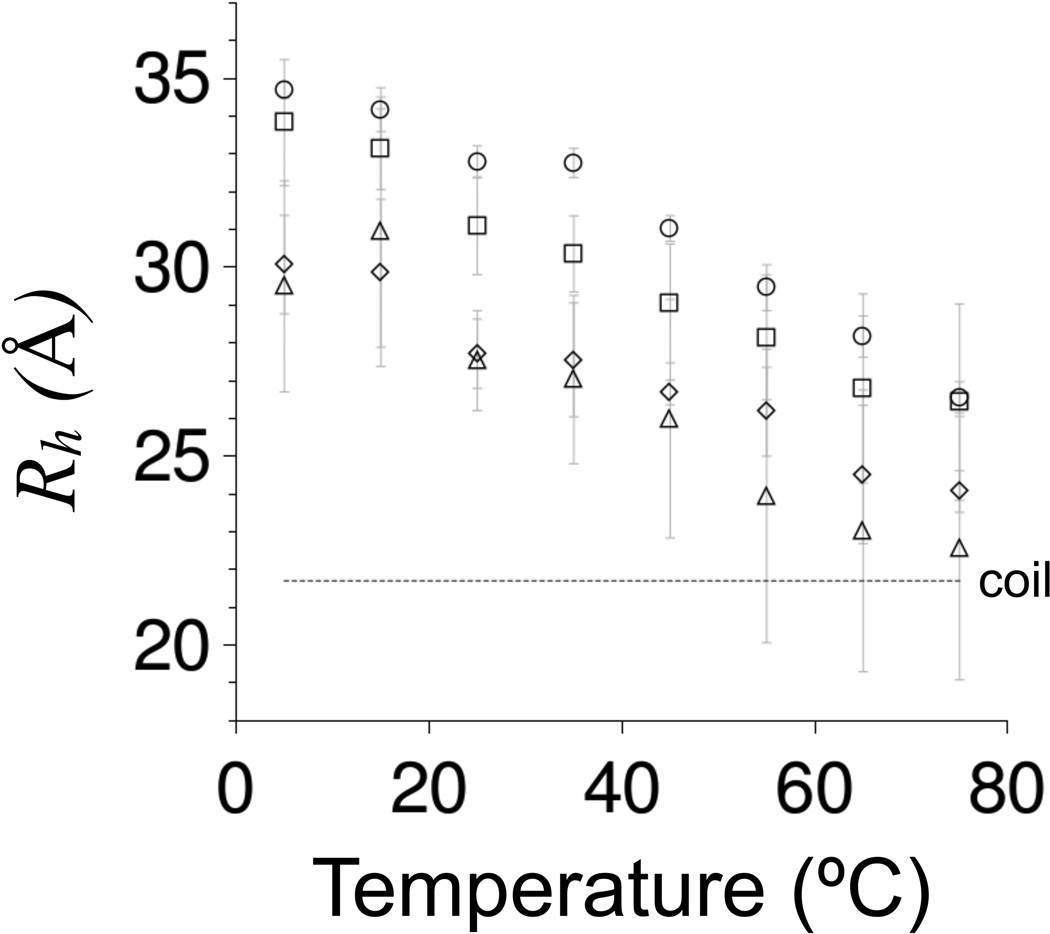
Figure 4. DLS-measured Rh for p53(1–93) from 5–75°C.
Rh values were shown using circles for wild type, squares for ALA−, triangles for PRO−, and diamonds for ALA−PRO−. Rh were measured using 0.25–0.75 mg/mL samples of protein in 10 mM sodium phosphate, 100 mM sodium chloride, pH 7. The reported values are the average of at least 5 measurements performed at each temperature and error bars represent standard deviations. The stippled line labeled “coil” shows Rh calculated for a 93-residue disordered protein using equations 1 and 2 with SPPII = 0.

