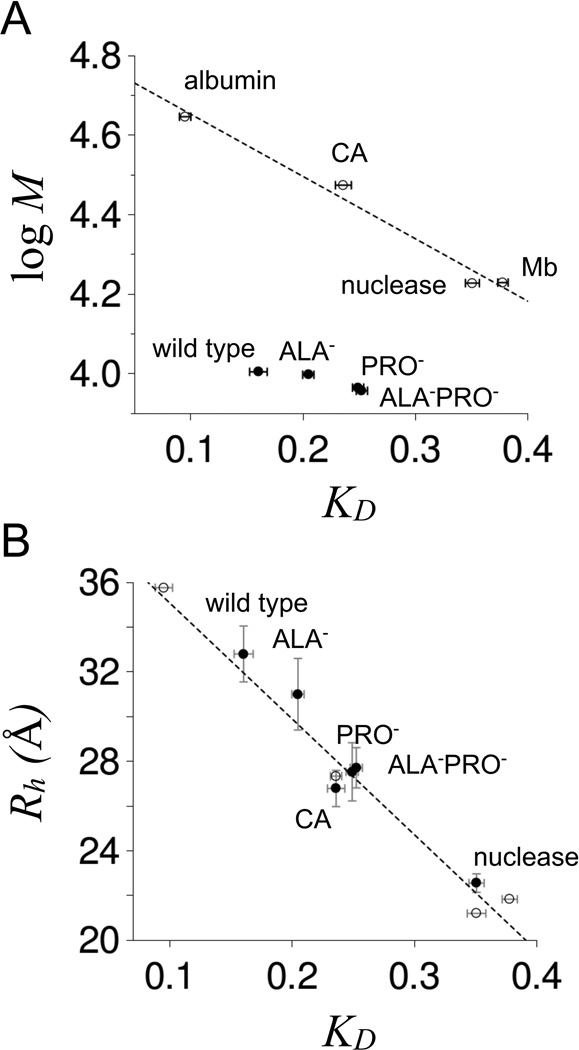
Figure 5. SEC-measuredKDfor p53(1–93) at room temperature.
Panel A shows a comparison of KD to molecular weight for wild type, ALA−, PRO−, and ALA−PRO− (filled circles). Open circles are KD measured for chicken albumin (44.3 kDa), bovine erythrocyte carbonic anhydrase (29.8 kDa, indicated as CA in the figure), staphylococcal nuclease (16.9 kDa), and horse myoglobin (16.95 kDa). Reported KD were the average of at least 3 measurements for each protein with error bars representing the standard deviations. Panel B shows a comparison of KD to Rh. Open circles are Rh estimated as one-half the maximum Cα-Cα distance in the crystallographic structures of albumin (48), carbonic anhydrase (49), nuclease (50), and myoglobin (51). The dashed line is a linear fit of Rh to KD applied to the open circles. Filled circles show Rh measured by DLS at 25°C for wild type, ALA−, PRO−, ALA−PRO−, carbonic anhydrase, and nuclease. KD were measured using 0.2 mg/mL samples of protein in 10 mM sodium phosphate, 100 mM sodium chloride, pH 7. DLS measurements used identical solution conditions except for 0.25–0.75 mg/mL protein concentrations.

