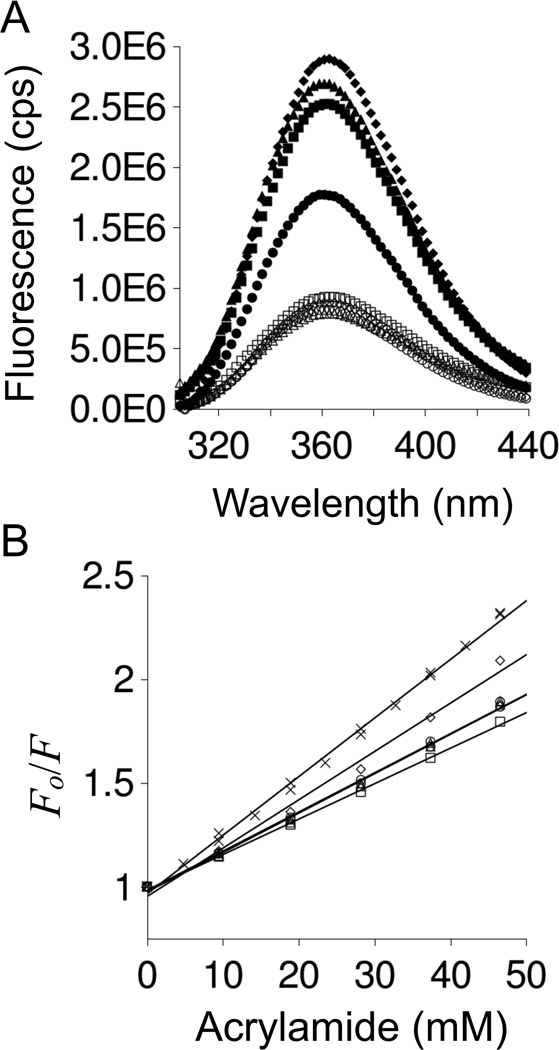
Figure 6. p53(1–93) fluorescence spectrum and acrylamide induced quenching of tryptophan fluorescence.
Panel A shows the fluorescence spectrum of p53(1–93) measured at 20°C using excitation wavelengths of 280 nm (filled markers) and 295 nm (open markers). Panel B provides Stern-Volmer plots of acrylamide induced quenching of tryptophan at 20°C. Both panels used circles for wild type, squares for ALA−, triangles for PRO−, and diamonds for ALA−PRO−. NATA is shown in panel B using (X). In both panels, fluorescence was measured using 0.5 µM p53(1–93) or 1.5 µM NATA buffered at pH 7 with 10 mM sodium phosphate, 100 mM sodium chloride.

