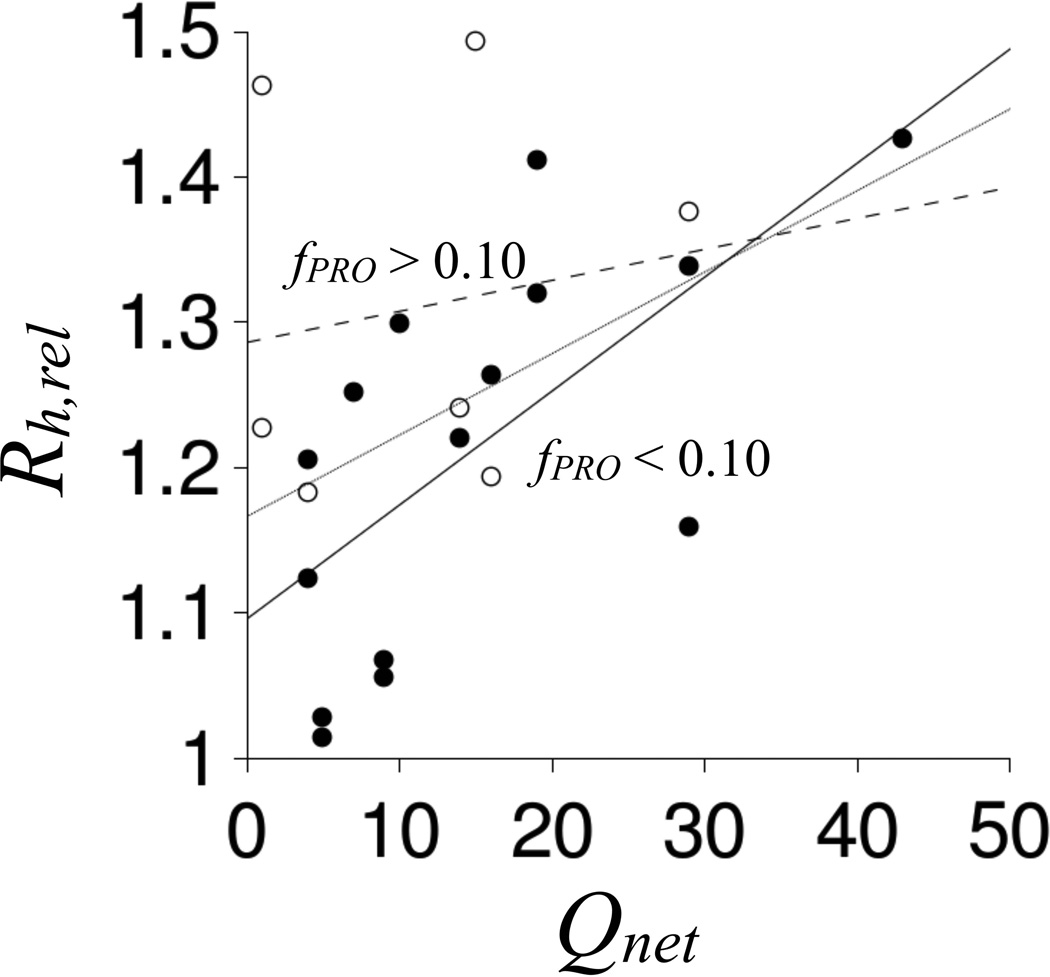
Figure 8. Comparison ofRh,relandQnetfor intrinsically disordered proteins.
IDPs with fPRO > 0.10 are shown using open circles. IDPs with fPRO < 0.10 are shown with filled circles. Lines represent linear fits of Rh,rel to Qnet for IDPs with fPRO > 0.10 (dashed), IDPs with fPRO < 0.10 (solid), and all IDPs (stippled).

