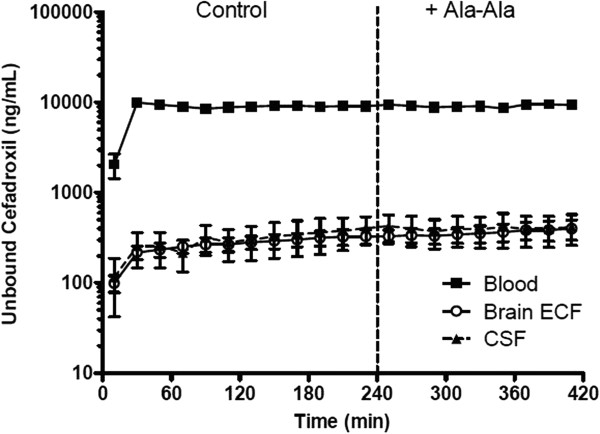
Figure 4.

The concentration-time profiles of unbound cefadroxil in rat blood, brain ECF, and CSF in the absence and presence of Ala-Ala. Solid squares represent the results in blood, open circles the results in brain ECF, and solid triangles the results in CSF. The vertical dashed line separates the two treatment phases (CEF ± Ala-Ala). Data are expressed as mean ± SEM (n = 7).
