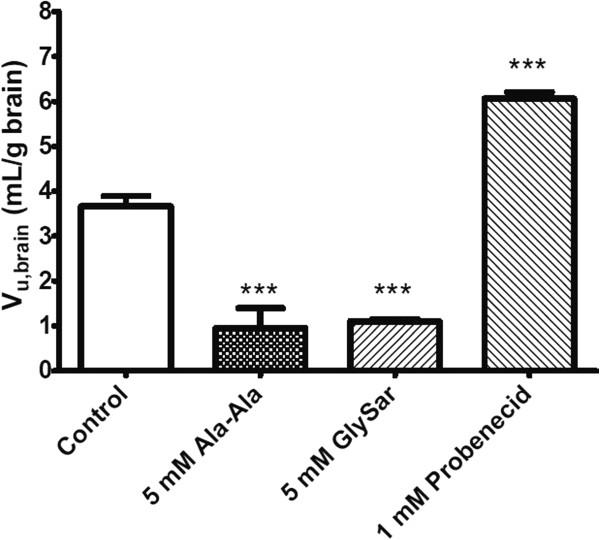
Figure 5.

The unbound volume of distribution of cefadroxil (V u,brain ) in rat brain slices. Studies were performed with 0.8 μM cefadroxil alone (Control) and in the presence of inhibitors (Ala-Ala, GlySar and Probenecid treatments). Data are expressed as mean ± SEM (n = 3-4). One-way ANOVA followed by the Dunnett’s test was performed to compare the inhibitor and control phases. ***p < 0.001 compared to control.
