
Figure 2.
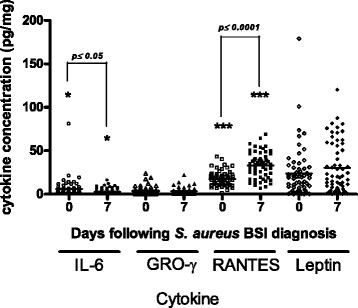
Scatter plot of the concentrations of four cytokines in all patient samples collected over the course of S. aureus BSI. Cytokine levels on the day of laboratory diagnosis and seven days after diagnosis of SABSI are shown (n = 61). Horizontal bars show the mean values for each cytokine.