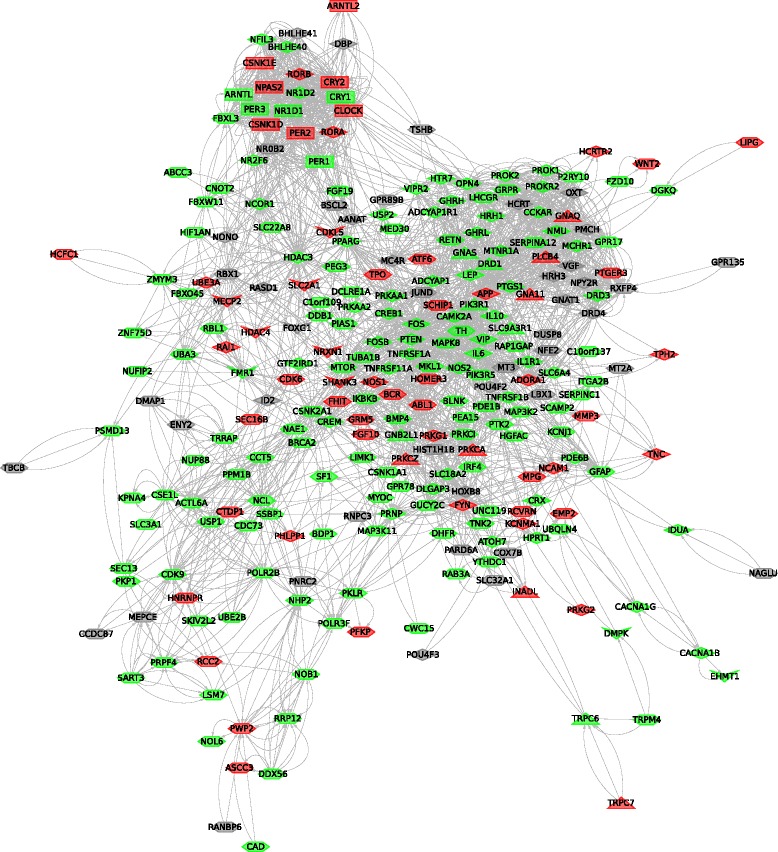
Figure 2.

Gene interaction network. Nodes represent genes and edges indicate interactions. Genes are coded as follows: green, at least one single nucleotide polymorphism (SNP) in the HGDP-CEPH panel; gray, not covered in the panel; red, at least one SNP significantly correlated with Δphotoperiod. Node shapes indicate the gene set: rectangle, core circadian; hexagon, RNAi hits; diamonds, mouse model genes; triangles, melanopsin-signaling components; arrows, human phenotype genes.
