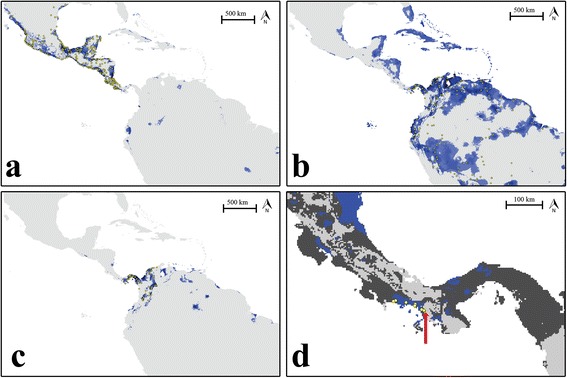
Figure 5.

Maxent-generated species distribution models (SDMs). a) Northern Jacana (J. spinosa); b) Wattled Jacana (J. jacana); c) the hypomelaena race of Wattled Jacana; d) Close-up of joint SDMs for spinosa and jacana in their contact zone. In a- c) yellow circles represent species observations used to generate the models, while blue indicates areas with high habitat suitability in our SDMs (range 0.4 – 1.0). In d) dark grey indicates areas where habitats are predicted to be suitable for only one taxon while blue indicates areas where models for both taxa have predicted suitability above 0.4. The red arrow indicates the hybrid zone center, on the eastern edge of a 100 km. wide region of suitable habitat for both species. Yellow circles represent locations where phenotypic hybrid specimens have been collected.
