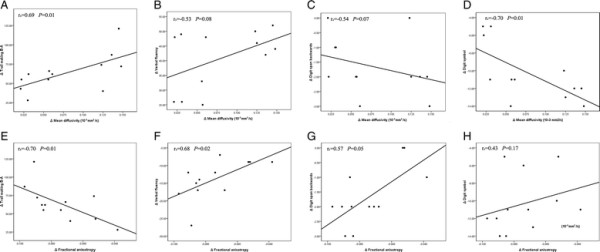
Figure 2.

Scatter plot with lines of best fit showing the relationship between the change values of diffusivity (mean diffusivity and fractional anisotropy) in the left frontal white matter and the change values of executive function (trail making B-A, verbal fluency assessment, digit span backwards and digit symbol tests) in patients from W1 to W12. A-H show the relationship between Δmean diffusivity and Δtrail making B-A (A), Δverbal fluency (B), Δdigit span backwards (C), Δdigit symbol (D), and between Δfractional anisotropy and Δtrail making B-A (E), Δverbal fluency (F), Δdigit span backwards (G), Δdigit symbol (H).
