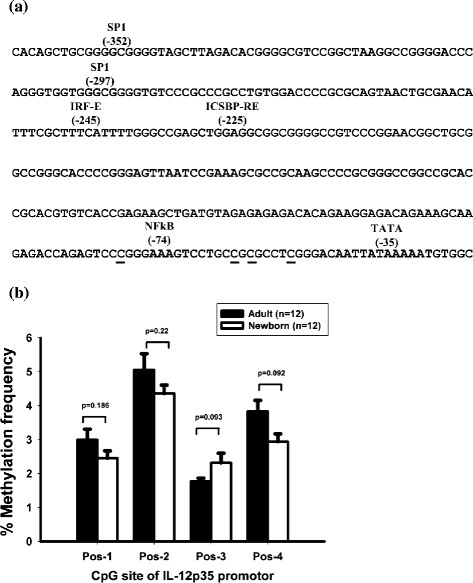
Figure 3.

Difference in methylation patterns. (a) Sequence of human IL-12 p35 promoter. The sequences of the PCR used to perform pyrosequencing are indicated by underline. (b) Whole blood methylation % of IL-12p35 promoter region. Each graphic represents each CpG island (pos-1, 2, 3 and 4). The percentages of methylation are represented by bars. The black bars represent adult and the white bars represent newborn percentage of methylation of the IL-12p35 promoter site.
