Figure 5.

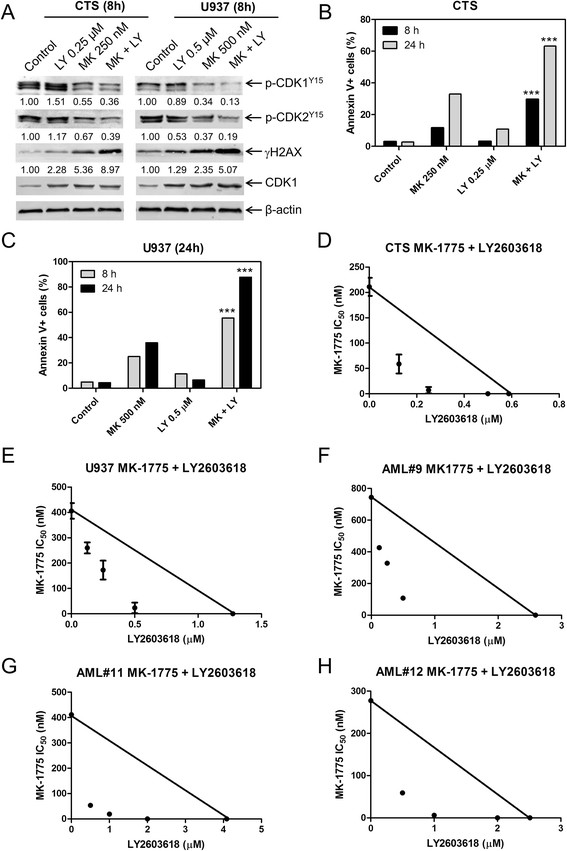
MK-1775 and LY2603618 synergize to induce apoptosis in AML cell lines and primary patient samples. Panel A: U937 and CTS cells were treated for 8 h. Whole cell lysates were subjected to Western blotting and probed with anti-γH2AX, -pCHK1, -p-cdc25c, -p-CDK1, -p-CDK2, -CDK1, or -β-actin antibody. Densitometry measurements, as described in the Materials and methods section, are shown below the corresponding Western blot. Panels B and C: CTS and U937 cells were treated with MK-1775 and LY2603618, alone or in combination, for 8 h and 24 h. Apoptotic events were determined by annexin V/PI staining and flow cytometry analyses. The data are presented as mean of triplicates ± standard error from one representative experiment. ***indicates p < 0.0005. Panels D-H: Standard isobologram analyses of antitumor interactions between MK-1775 and LY2603618 in the CTS cell line (Panel D), U937 cell line (Panel E), and patient samples (Panels F-H). The IC50 values of each drug are plotted on the axes; the solid line represents the additive effect, while the points represent the concentrations of each drug resulting in 50% inhibition of proliferation. Points falling below the line indicate synergism whereas those above the line indicate antagonism. The data for the CTS and U937 cell lines are presented as mean values ± standard errors from at least three independent experiments, while the data for the patient samples are presented as mean of duplicates from one experiment.
