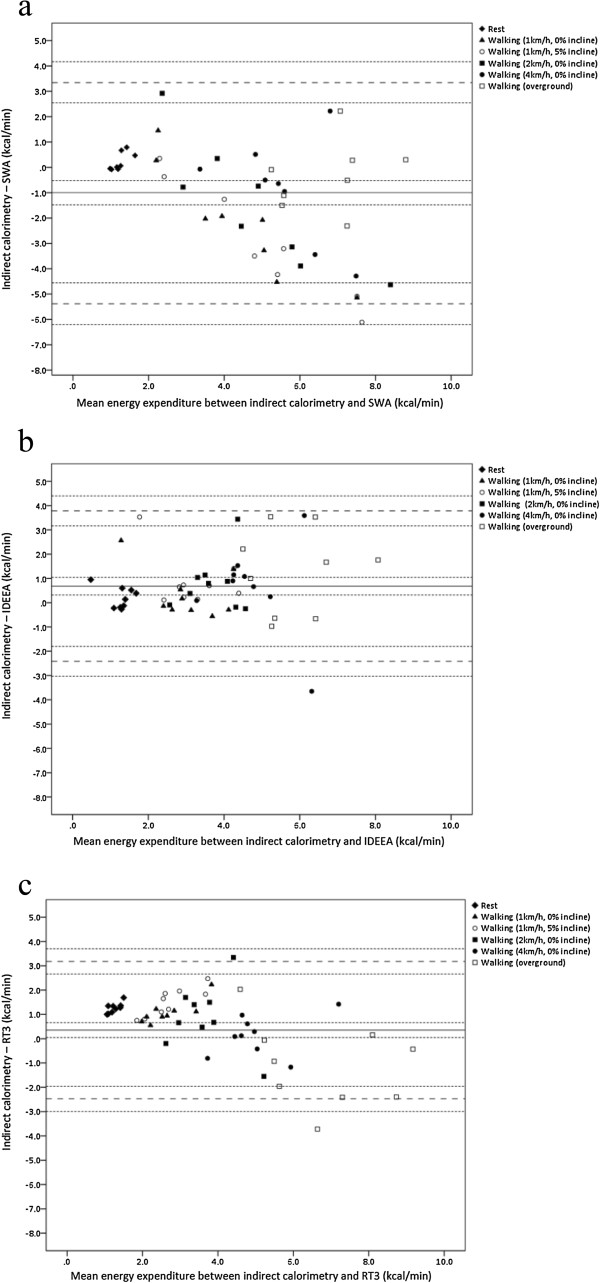
Figure 2.

Bland-Altman plots between energy expenditure from the indirect calorimeter (IC) and accelerometry-based devices for adults. The middle solid lines represent the mean difference between the methods for parts a) IC vs. SWA, b) IC vs. IDEEA, and c) IC vs. RT3. The wide dashed lines represent the upper and lower limits of agreement. The narrow dashed lines represent the 95% confidence intervals.
