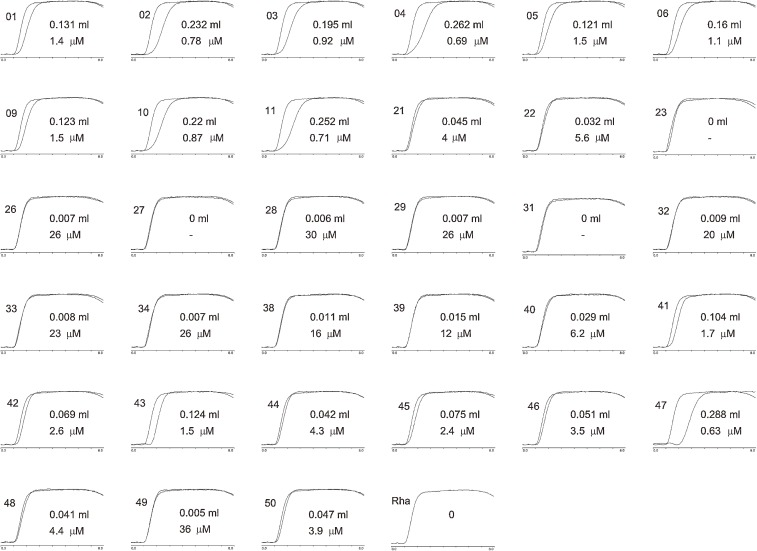
Figure 5.
An example of profiling of a lectin (human galectin-3). Various PA-saccharides were applied to a column (0.126 ml) packed with an affinity adsorbent having human galectin-3 as immobilized ligand. A solution of each PA-saccharide (2 ml, 10 nM) was applied to the column at a flow rate of 0.25 ml/min at 20 ℃, pH 7.2. Each elution pattern of PA-saccharide was superimposed on that of PA-rhamnose, which has no affinity for the galectin, so that the retardation could be seen. Extent of retardation (ml) and calculated dissociation constant (µM) are indicated in each panel. Since this experiment was carried out by using a set of PA-saccharides different from that shown in Fig. 7, the numbers indicated on the panels do not correspond to those of Fig. 7. Corresponding numbers indicated in Fig. 7 for each of elution patterns showing significant retardation are as follows (numbers in parentheses are those shown in Fig. 7). 01(01), 02(02), 03(03). 04(04), 05(05), 06(06), 09(07), 10(08), 11(09), 21(10), 40(24), 41(26), 42(27), 43(28), 44(29), 45(30), 46(31), 47(32) and 50(38). See ref. 28) for detail.

