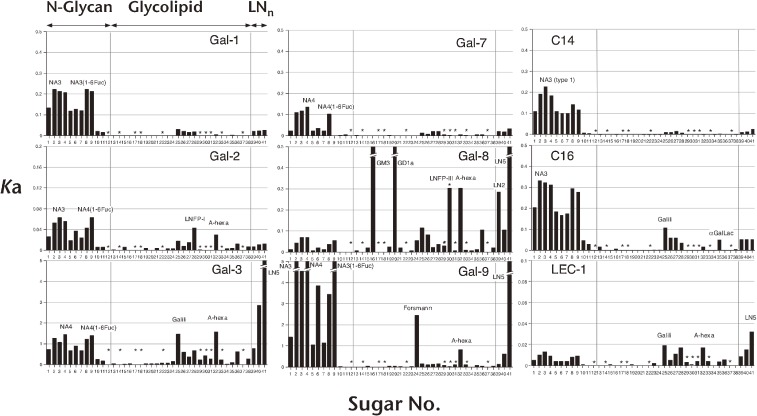
Figure 6.
Saccharide-binding profiles of 9 galectins revealed by FAC. Bars represent association constants (Ka × 106 M−1) towards PA-saccharides. Structures of PA-saccharides are shown in Fig. 7. Gal-1, -3, -7, -8, and -9 are from human, Gal-2 is from rat, C14 and C16 are from chick, and LEC-1 is from C. elegans.

