Figure 2.

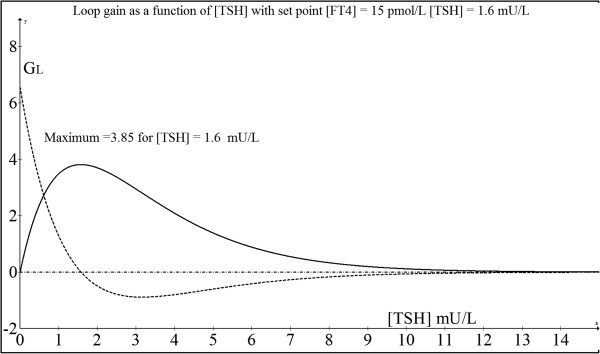
Plot of loop gain as a function of TSH (solid line). This shows a maximum loop gain at the set point while the first derivative of the loop gain is illustrated by the dotted line.

Plot of loop gain as a function of TSH (solid line). This shows a maximum loop gain at the set point while the first derivative of the loop gain is illustrated by the dotted line.