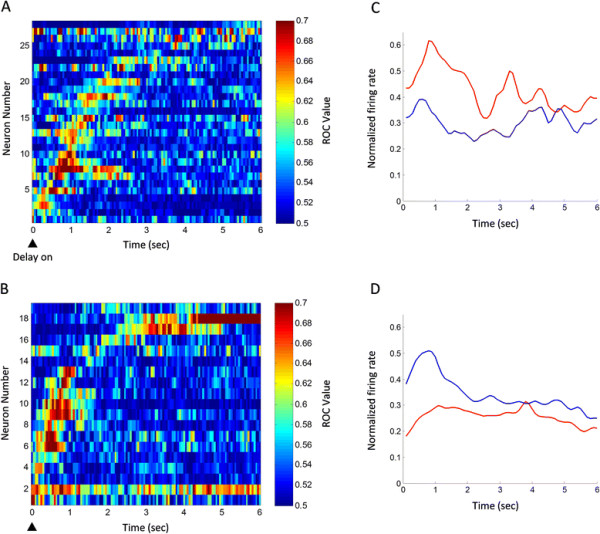
Figure 5.

Temporal evolutions of the spatial preference of differential delay neurons. (A) The ROC values of neurons with preference for left trials. (B) The ROC values of neurons with preference for right trials. Each raster represents the ROC value of an individual cell, which was aligned with the onset of the delay period. The cells were sorted by time when their ROC values first reached 0.61 in three consecutive bins (100 ms bin, 50 ms step). The colors in each grid represented ROC values. (C) and (D) are the average PSTH of neurons with preference for left and right trials, respectively. The normalized firing rate (Fn) is calculated by the formula: Fn = (F-Min)/(Max-Min), where F is the firing rate of neurons, Min and Max are the minimum and maximum of the firing rate, respectively. Red line: left trial; blue line: right trial.
