
Fig. 8.
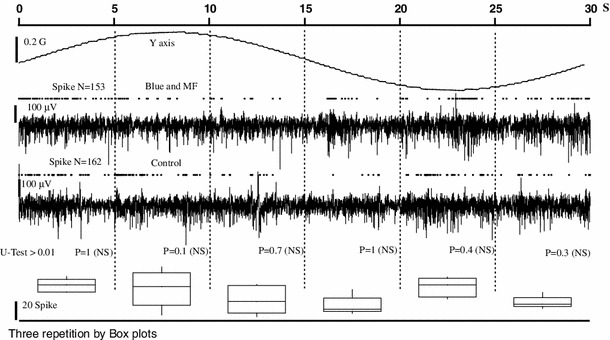
Segment method to assess responsivity of tectal units in a magnetic field (spike signal). The two neural signals represent the multiunit activity of tectal neurons in control (third trace) and in the presence of a magnetic field and blue light (second trace) for the indicated magnetic field (first trace)—above neural traces spikes are represented by dots. A first observation reveals that the raw activity (measured in terms of total number of detected spikes per stimulation cycle) is not different between the two conditions (153 vs 162 spikes). As these experiments were done in an awake pigeons, a spontaneous and variable discharge was observed. To assess a possible magnetic effect, the complete run was divided in six 5 s segments. The total number of spikes in each segment in both conditions was compared with the U Mann–Whitney test (aggregating the three repetitions done for every condition). The U-statistics, given below the control trace, show that no difference could be detected for experimental and control conditions [the p-statistics were larger that 0.01 thus differences were not significant (NS)]. Furthermore, to show the intrinsic variability of discharge rate, we considered together the spike data from control and experimental conditions, and we represented these sets (6 numbers) by their boxplots (lower panel). It is immediately apparent how variable is the discharge rate in awake pigeons (compare boxplots from the second and fourth segments). In all nine experiments we could not detect a modulation of the discharge rate