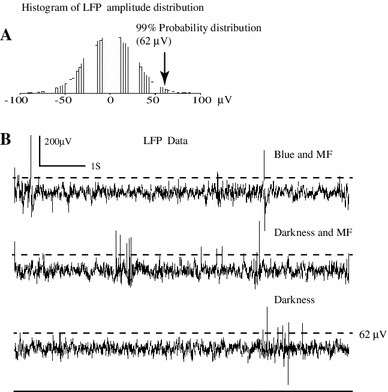
Fig. 9.

Method to assess responsivity of tectal units to magnetic field using LFP amplitudes. The slow signal from the control situation was used to build a histogram of amplitudes (a). The x-coordinate corresponding to 99 % was calculated (arrow). This value was used to calculate the amount of time that neural signals in experimental conditions were above this value. If the amount of time that the signal was above this limit was higher than 2 % we counted it as a positive event (b)
