Figure 1.

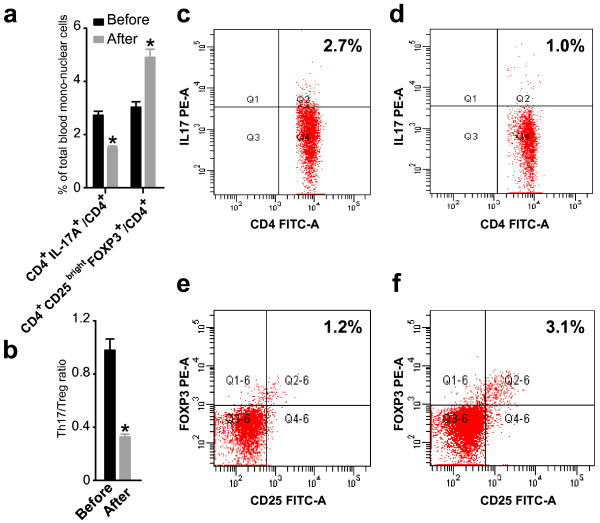
The percentages of Th17 and Treg cells in peripheral blood mononuclear cells and the Th17/Treg ratio varied with immunotherapy. The percentage of Th17 and Treg cells in peripheral blood mononuclear cells were detected by flow cytometry in the total patient population before and after immunotherapy, respectively. (a) The percentage of Th17 cells in peripheral blood mononuclear cells significantly decreased after immunotherapy (P < 0.01, paired t-test). Bar represents the CD4+/IL-17A+ cell frequency and values of the means ± S.E. The percentage of Treg cells in peripheral blood mononuclear cells significantly increased after immunotherapy (P < 0.01, paired t-test). Bar represents the frequency of CD4+/CD25bright/Foxp3+ cells and the means ± S.E. are shown. (b) The Th17/Treg ratio in peripheral blood mononuclear cells significantly decreased after immunotherapy (P < 0.01, paired t-test). Bar represent Th17/Treg ratio in total patients before and after immunotherapy and values of means ± S.E. Representative CD4+/IL-17A + flow cytometry plots in patients are shown before (c) and after (d) immunology. Representative CD4+/CD25bright/Foxp3+ flow cytometry plots in patients are shown before (e) and after (f) immunology.
