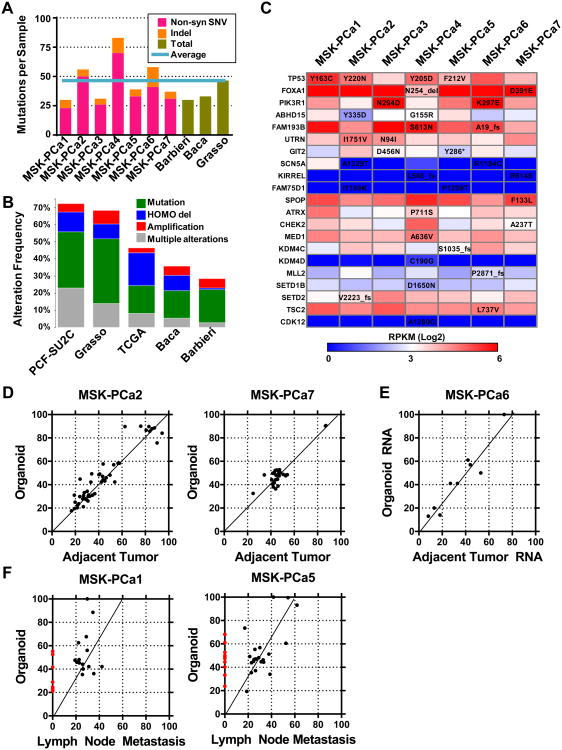
Figure 2. Mutational landscape of patient-derived prostate cancer organoid lines.
A. Quantification of number of non-synonymous single nucleotide variations (SNV, pink) and insertion-deletions (Indel, orange) in each organoid sample compared to average total SNV and Indels of published whole-exome datasets (green). The light blue line represents the average mutations of the seven organoid lines. B. The alteration rate (green: mutation, including both non-synonymous SNV, blue: homozygous deletion, red: amplification, grey: multiple alterations) of genes mutated in the 7 organoid samples in prostate cancer datasets. C. Table of genes that are mutated in more than one sample as well as genes with putative functional oncogenic significance. The genes are color-coded by RNA-Seq based mRNA expression quantified as reads per kilobase mapped (RPKM). See also Figure S2 for view of TP53 and SPOP mutations. See also Table S1 for quality metrics of WES and Table S2 for all a list of all somatic mutations associated gene expression. D. Scatterplot of allele frequencies of point mutations (single-nucleotide variant, SNV) determined by whole-exome DNA sequencing between organoid sample and adjacent tumor tissue of MSK-PCa2 and MSK-PCa7. Most points lie on the regression line, suggestion preservation of the mutational landscape. E. Scatterplot of allele frequencies of expressed SNVs determined by RNA-Seq sequencing between organoid sample and adjacent tumor tissue. Among the expressed subset of SNV's, the allele frequencies lie on the regression line suggesting preservation of the mutational landscape. F. Scatterplot of allele frequencies of SNVs determined by whole-exome DNA sequencing between organoid sample and FFPE lymph node metastasis from ∼1 year prior of MSK-PCa1 and MSK-PCa5. The red dots indicate mutations found only in the organoid line. Some mutations lie above the regression line of the common mutations, indicating that they have gained allele frequency from primary tumor to organoid line. The slope of the regression line of ∼0.6 suggests 60% tumor purity of the lymph node specimen. See also Figure S2, Tables S1, S2 and S3.

