
Figure 4. Prostate cancer organoids exhibit diverse gene expression profiles.
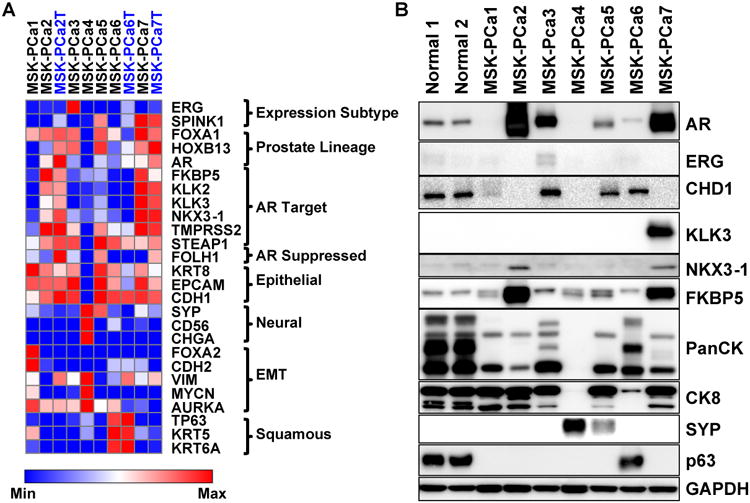
A. Heatmap of RNA expression of selected genes of seven organoid samples and three matched tumor samples (MSK-PCa2T, MSK-PCa6T, MSK-PCa7T) annotated in blue font. The genes are grouped by prostate cancer subclasses (ERG, SPINK1), prostate lineage transcription factors (FOXA1, HOXB13, AR), androgen receptor target genes (FKBP5, KLK2, KLK3, NKX3-1, TMPRSS2, STEAP1), a prostate lineage AR suppressed gene PSMA (FOLH1), epithelial markers (CK8, EPCAM, E-cadherin:CDH1), neuroendocrine markers (synaptophysin A:SYP, NCAM:CD56, chromogranin A:CHGA), genes whose expression is associated with epithelial to mesenchymal transition (FOXA2, N-cadherin:CDH2, vimentin: VIM, N-myc:MYCN, aurora kinase A: AURKA), squamous markers (TP63, KRT5, KRT6A). For each gene, the expression was log2 transformed and heatmap range is from minimum to maximum. B. Western Blot of selected proteins validating mRNA expression. Note pancytokeratin recognizes a pattern of low and high-molecular weight keratins. MSK-PCa6 displays a range similar to normal prostate organoids that contain both basal and luminal cells and MSK-PCa4 has lost expression of all cytokeratins. See also Figure S4 for hierarchical clustering of organoid mRNA expression and gene expression analysis of Michigan CRPC dataset. See also Figure S1 and S4.