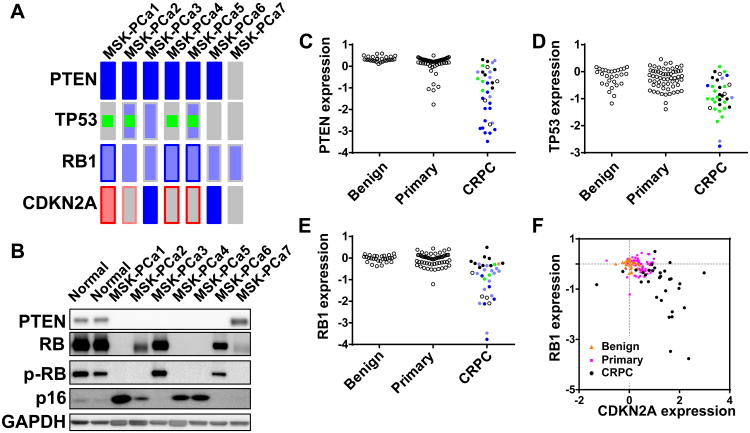
Figure 5. Loss of tumor suppressors PTEN, TP53, RB1, and CDKN2A in prostate organoid lines.
A. Oncoprint view of PTEN, TP53, RB1, and CDKN2A. The fill of the rectangle denotes copy number change (HOMOLOSS: dark blue, HETLOSS: light blue, GAIN: red). The border of the rectangle denotes gene expression change. Green square denotes mutation. B. Western Blot of PTEN, RB, phosphorylated RB (S807/S811), p16, and GAPDH of normal prostate organoids and prostate cancer organoid lines. C-E. Gene expression of PTEN, TP53, and RB1 in normal prostate tissue, primary cancer, and CRPC from the Michigan dataset. For CRPC, copy number and mutational data is available for most samples. Open circles indicates that mutational/copy number data is not available. Green fill indicates mutation. Light and dark blue fill indicates heterozygous and homozygous loss. F. Scatter plot of gene expression of RB1 and CDKN2A in benign (orange triangle), primary cancer (pink square) and CRPC (black circles). See also Figure S5 for RNA-Seq and Array-CGH tracks of CDKN2A.

