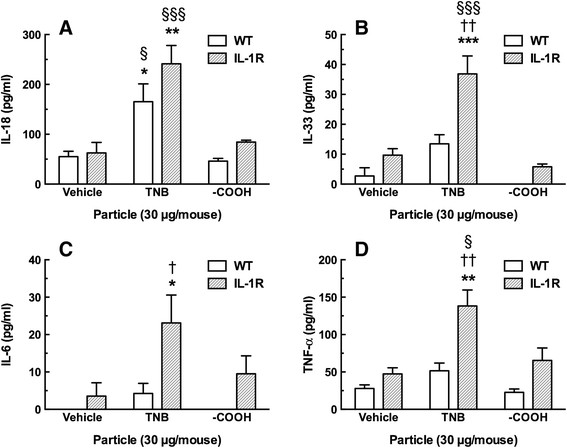
Figure 11.

Summary data of lavage fluid cytokines 24 h following TiO2nanobelt instillations in the lungs of C57BL/6 mice and IL-1R null mice. A) Mean ± SEM IL-18 release. B) Mean ± SEM IL-33 release. C) Mean ± SEM IL-6 release. D) Mean ± SEM TNF-α release. Asterisks indicate significance at *** P < 0.001, ** P > 0.01 or * P < 0.05 compared to corresponding dispersion media vehicle (DM). Daggers indicate significance at †† P < 0.01, or † P < 0.05 compared to the corresponding wild-type particle instillation condition. Symbols §§§ indicate significance at P < 0.001, or § P < 0.05 compared to the corresponding TiO2 –COOH nanobelt (TNB COOH) instillation.
