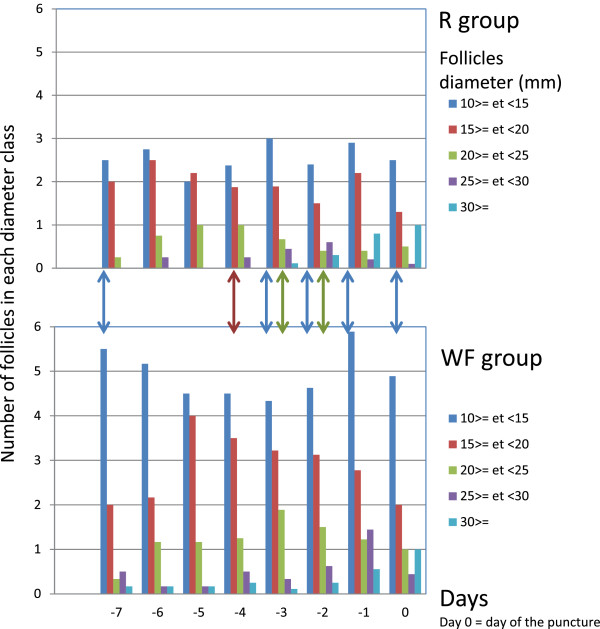
Figure 1.

Mean numbers of follicles in each class diameter on each day for the 2 experimental groups. The vertical arrows (with the same colours as the follicle categories) indicate when the number of follicles is significantly higher according to an exact unilateral Wilcoxon test with p < 0.05.
