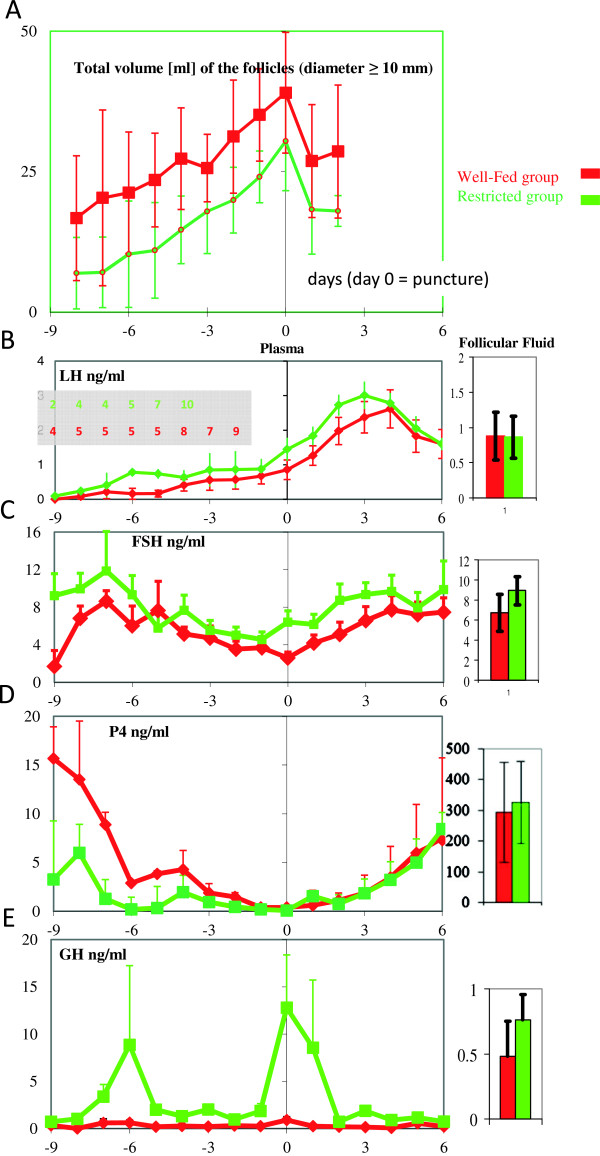
Figure 2.

Follicular growth and the daily variation of FSH, LH, GH and P4 concentrations in plasma and FF in WF and R mares as a function of the day of puncture (Day 0). A) Sum of the volumes of all the measured follicles (diameter > 10 mm), including the dominant follicle, extrapolated as a sphere. B) LH: On the day of the puncture, LH concentrations were not significantly different between treatment groups or between FF and plasma. The table included in the figure gives the number of mare plasma samples assayed before all mares are collected. C) The FSH concentration was significantly higher in plasma from R mares than in plasma from WF mares, but this difference was not significant in FF or between plasma and FF. D) P4: On the day of puncture, P4 concentrations were not different between treatment groups but were significantly higher (p > 0.0001) in FF than in plasma. E) GH: On the day of puncture, GH concentrations were significantly higher (p = 0.008) in mares with restricted diets, but no significant difference between plasma and FF was observed.
