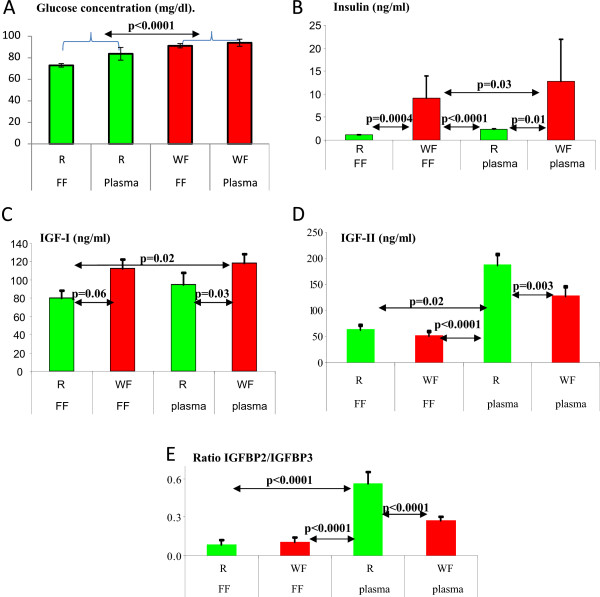
Figure 4.

Plasma and FF levels of glucose, insulin, IGF-1 and IFG-2 and IGFBP2/IGFBP3 ratios in the WF and R treatment groups. A) Glucose concentrations, measured via the glucose oxidase method on the day of puncture are globally higher (p < 0.0005) in well-fed mares than in those receiving a restricted diet, although no global difference appeared between follicular fluid and plasma. B) Insulin: On the day of puncture, insulin concentrations were higher (p < 0.0001) in the well-fed treatment group compared to the restricted-diet group, but no significant difference was present between FF and plasma. C) IGF-1: On the day of puncture, IGF-1 concentrations were globally higher (p < 0.0061) in the well-fed treatment group compared to the restricted diet group, but there was no significant difference between FF and plasma. D) IGF-2: On the day of puncture, IGF-2 concentrations were higher (p < 0.0028) in the restricted diet treatment group compared to the well-fed group and in plasma compared to FF. E) IGFBP2-to-IGFBP3 ratio: On the day of puncture, the IGFBP2-to-IGFBP3 ratio, treatment group effects, FF/plasma effects and the interaction between treatment groups and FF/plasma were significant (p < 0.03).
