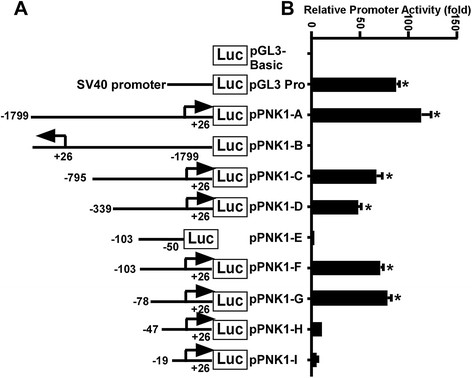
Figure 2.

Deletion analysis of the human PINK1 gene promoter. (A) Schematic diagram of the PINK1 promoter constructs consisting of the 5’ flanking region with serial deletions cloned into the pGL3-basic vector. Arrow shows the direction of transcription. The numbers represents the end points of each construct. (B) The deletion plasmids were cotransfected with pCMV-Luc into HEK293 cells. 24 h after the transfection, the luciferase activity was measured and expressed in relative luciferase units (RLU). The pCMV-Luc was used to normalize for transfection efficiency. The values represent means ± SEM. n = 3, *p < 0.0001, by one-way ANOVA followed by post hoc Tukey’s multiple comparisons test.
