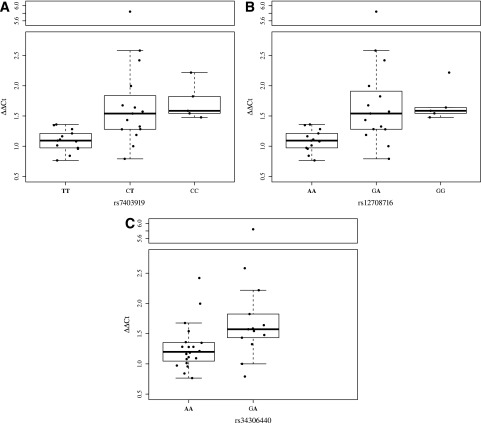
Figure 2.
Expression levels of DEXI grouped by genotypes of SNPs rs7403919 (A), rs12708716 (B), and rs34306440 (C). Alleles associated with type 1 diabetes are in boldface. The centerlines represent the median value, box area represents upper and lower quartiles, the whiskers represent 1 SD from the mean.

