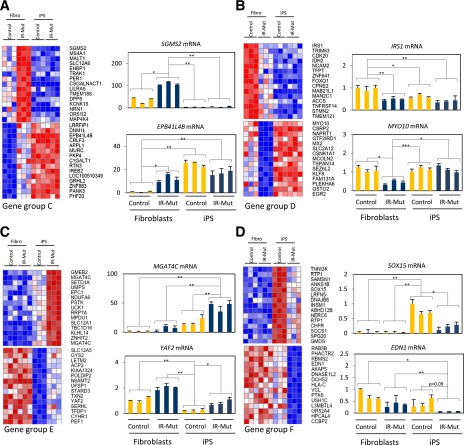
Figure 7.
Gene expression analysis of gene groups C–F. A–D: Heat maps and mRNA expression of gene groups C–F. Heat maps represent the top 30 significant genes of gene groups C–F normalized by row (P < 0.05, q < 0.1), with qRT-PCR analysis in adjacent graphs. *P < 0.05, **P < 0.01, ***P < 0.001 average of controls vs. mutants.

