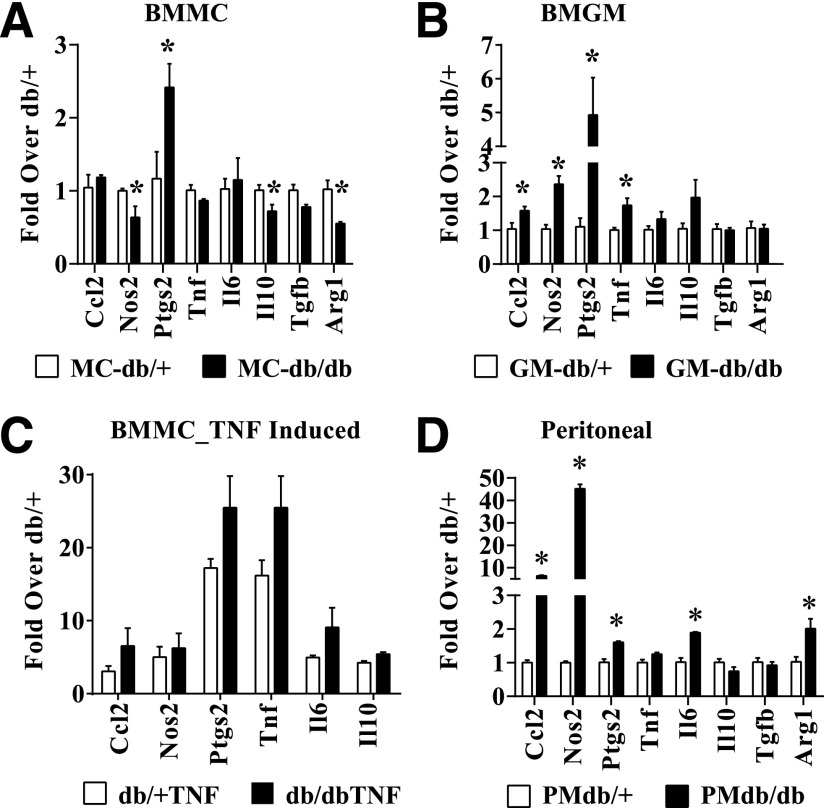
Figure 1.
Diabetes induces dysfunctional macrophage polarization. A and B: RT-QPCR analysis of gene expression in BMM derived from diabetic db/db mice and control db/+ mice, which were differentiated in vitro with either M-CSF (BMMC; panel A) or GM-CSF (BMGM; panel B). Bone marrow was isolated from 10–12-week-old db/db and db/+ mice. Blood glucose levels were 479 ± 28 mg/dL in db/db mice versus 162 ± 8 mg/dL in db/+ mice. C: TNF-α–induced gene expression in db/+ and db/dbBMMC. BMMC were serum depleted for 4 h and stimulated with TNF-α (10 ng/mL) for 1 h. D: Gene expression analysis of thioglycolate-elicited PMs from db/+ (PMdb/+) and db/db (PMdb/db) mice. Gene expression was analyzed by RT-QPCR and results expressed as fold over db/+ cells. Data are represented as mean ± SEM. *P < 0.05, n = 3–4.

