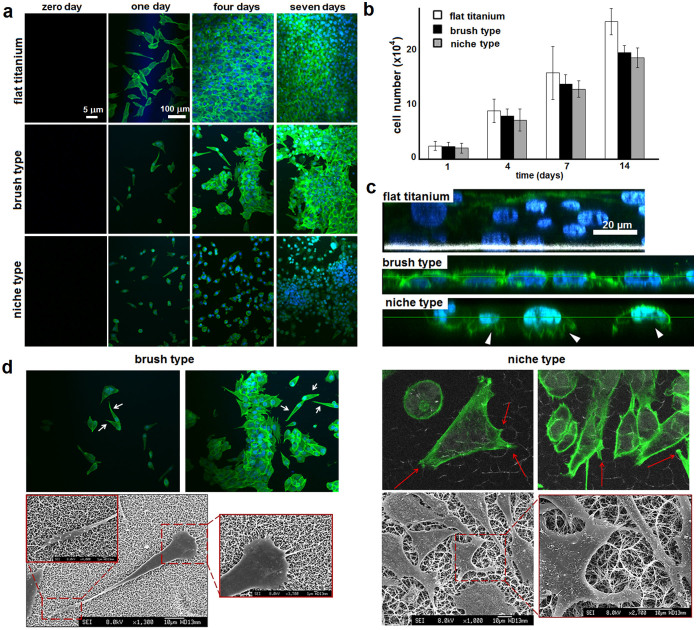
Figure 4. Cell adhesion and proliferation.
(a) Fluorescence micrographs of MG-63 osteoblast-like cells on different surfaces. (b) Total viable cell count determined by the PrestoBlue® cell viability assay as a function of time. (c) Z-stack fluorescence images after seven-day incubations showing depth profiles of cell multilayers on flat titanium, continuous monolayers on the brush type and cell clustering on the niche type. White arrowheads point to lamellipodia. (d) Fluorescence (upper) and scanning electron (lower) micrographs showing distinctive cell morphologies after four-day incubations. White and red arrows highlight teardrop-shaped cells and lamellipodia reaching into the pockets, respectively.

