
Figure 4. CLSM observation of nHAP in Bel-7402 cells (a) and L-02 cells (b).
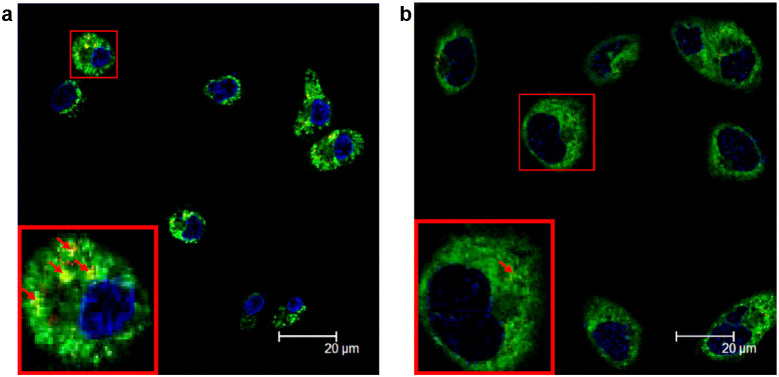
The small arrows show the particles around ER in the cells. The cells in the left-bottom frames are the magnification graphs.
Official websites use .gov
A
.gov website belongs to an official
government organization in the United States.
Secure .gov websites use HTTPS
A lock (
) or https:// means you've safely
connected to the .gov website. Share sensitive
information only on official, secure websites.
The small arrows show the particles around ER in the cells. The cells in the left-bottom frames are the magnification graphs.