
Figure 5. Intrinsic noise significantly affects expression variability of Nanog.
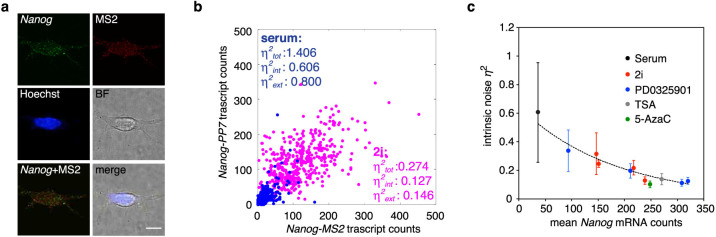
(a) Allele-specific single-molecule fluorescent in situ hybridization (smFISH) analysis. NMP cells cultured in serum condition were subjected to smFISH analysis using Nanog exonic smFISH probes and MS2 probes. Cellular nuclei were counter-stained with Hoechst33342. Each image is a maximum intensity projection of image stacks. The probe position is described in Figure 2a. Scale bar, 10 µm. (b) Scatter plot of Nanog-MS2 and -PP7 transcripts. Nanog-MS2 and -PP7 transcripts were counted in each cell by allele-specific smFISH. η2int, η2ext, and η2tot represent intrinsic, extrinsic and total noise, respectively. The Fano factors of Nanog mRNA are 39.9 and 50.3 in serum and 2i conditions, respectively. (c) Scatter plot of mean Nanog mRNA counts and intrinsic noise. Distributions of Nanog-MS2 and -PP7 mRNAs in cells cultured in several conditions were obtained by allele-specific smFISH analyses as in (b). Afterward, the mean Nanog mRNA counts and noise values were calculated and plotted. Dashed line represents a trend line obtained from data of cells cultured in media containing 2i and PD0325901 as calculated using Microsoft Excel. Error bars are 95% confidence intervals obtained by bootstrapping. Concentrations of inhibitors in each culture condition are listed in Supplementary Table S1.