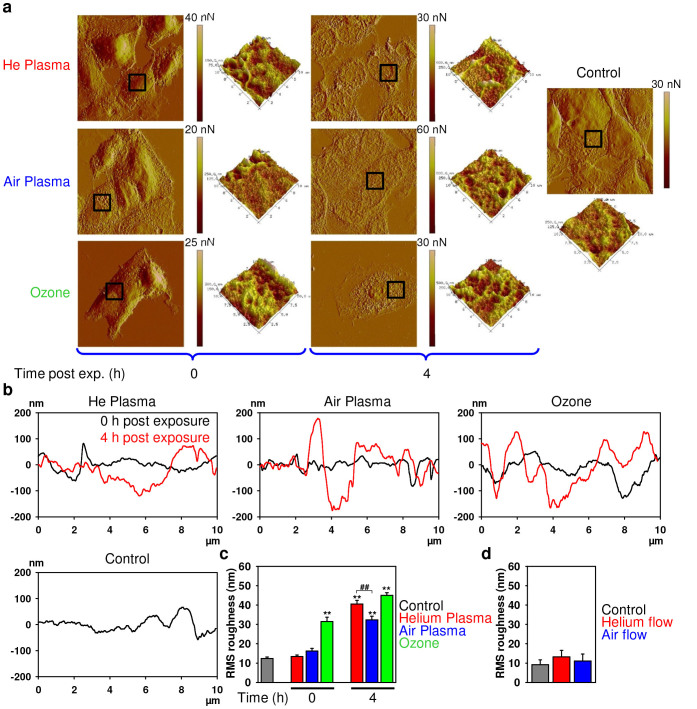
Figure 5. AFM analysis of cell membrane integrity.
(a) 3T3 fibroblasts were treated with air, helium or ozone for 30 s, and then 0 or 4 h after treatment cells were fixed and imaged with AFM microscopy. Images represent a 90 × 90 µm area of scan. The black square areas indicate where a 3D 10 × 10 µm scan has been performed. (b) Representative surface profiles of 10 × 10 µm scanned area of the cell treated as in (a). (c) AFM microscopy quantification of membrane roughness of the cell treated as in (a). (d) AFM microscopy quantification of membrane roughness of 3T3 fibroblasts were treated with air, helium flow (no plasma treatment), and then 4 h after treatment cells were fixed and imaged with AFM microscopy.

