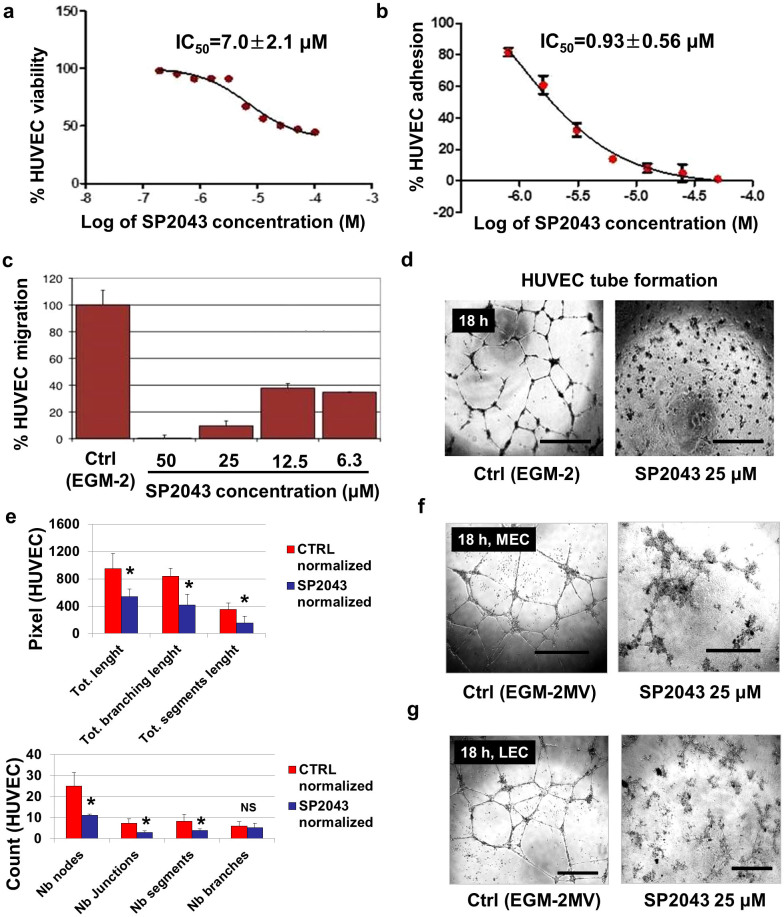
Figure 1. In vitro activity of SP2043 on HUVEC, MEC, and LEC.
SP2043 blocks angiogenesis and lymphangiogenesis in vitro. The controls for cell viability, migration, adhesion, and tube formation assays correspond to cell phenotypes in normal endothelial growth media (EGM-2 in the HUVEC experiment, or EGM-2MV in LEC and MEC experiments). (a) Inhibition of HUVEC viability. (b) Inhibition of HUVEC adhesion. (c) Inhibition of HUVEC migration. (d) Inhibition of HUVEC tube formation at 18 h. Scale bars represent 200 μm. (e) Quantification of (d). HUVEC tube formation was quantified by using Angiogenesis Analyzer for ImageJ (NIH). The process is described in the Supplementary Fig. S8 online and Methods. Briefly, the original images (3 images per group) were transformed to the skeletonized binary tree images. These were analyzed and all the values were normalized with the analyzed area. Number of nodes (Nb nodes), Nb junctions, Nb segments, Nb branches, total length (Tot length), Tot branching length, and Tot segment length were obtained (*P < 0.05). (f) Inhibition of MEC tube formation at 18 h. Scale bars represent 200 μm. (g) Inhibition of LEC tube formation at 18 h. Scale bars represent 200 μm. Data (a,b,e) are reported as mean ± s.e.m.

