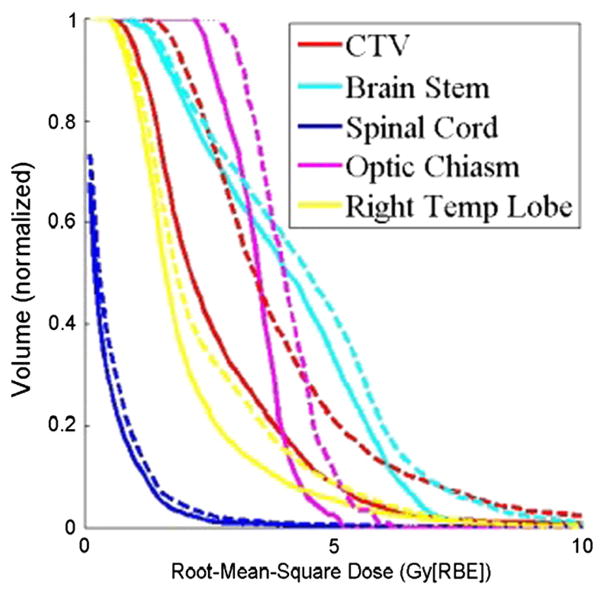
Figure 2.
The RVH curves derived from the robust plan (solid lines) and the PTV-based plan (dashed lines) for patient 7. Each curve was normalized by the total volume of the corresponding organ. RVH AUCs for the robustly optimized plan were smaller than those for the PTV-based plan, indicating that AUCs can be useful for relative comparisons of the plans in terms of robustness. (AUC, area under the RVH curve; CTV, clinical target volume; PTV, planning target volume; RBE, relative biologic effectiveness; RVH, RMSD volume histograms; Right Temp Lobe, right temporal lobe)

