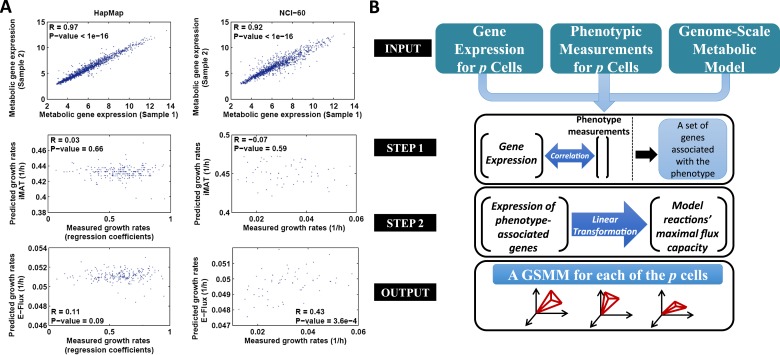
Figure 1. The PRIME pipeline and growth rate predictions obtained by different methods.
(A) Upper panel: Spearman rank correlation between the metabolic gene expression of two representative cell lines in the HapMap (left) and NCI-60 (right) datatset (the two cell lines represent the average correlation across the entire datasets); Middle panel: Spearman rank correlation between predicted and measured growth rates in the HapMap (left) and NCI-60 (right) datatset as predicted by iMAT, a method that utilizes discrete gene expression signature as input; Lower Panel: Spearman rank correlation between predicted and measured growth rates in the HapMap (left) and NCI-60 (right) datatset as predicted by E-Flux, a method that utilizes absolute gene expression levels as input. (B) A schematic overview of PRIME. As input, PRIME gets a GSMM and gene expression measurements for p cells together with their associated phenotypic measurement (e.g., proliferation rate). (Step 1): A set of genes whose expression is significantly associated with the phenotype is identified. (Step 2): A linear transformation from the expression of the phenotype-associated genes, to reactions' upper bound (maximal flux capacity) is applied (‘Materials and methods’). PRIME outputs a GSMM for each of the p input cells, such that each cell model generates a different feasible flux solution space. See also Figure 1—figure supplement 1.


